
Engagement Rate Benchmarks for Influencer Campaigns in 2026

There is no single engagement rate to chase. Recent benchmark studies put a typical figure anywhere from roughly 0.5% to above 5%, depending on the platform, the formula and who was measured. A brand booking creators needs three things: the benchmark that matches the format being bought, the formula behind it, and a brief that turns the number into a contract.
This guide sets out the current figures for Instagram, Reels and TikTok, explains why they disagree, and then moves from measurement to the practical side of a booking: deliverables, posting schedule, turnaround and payment terms.
TL;DR
- Engagement rate is total interactions divided by a denominator (followers, reach or views) and multiplied by 100. Change the denominator and the benchmark changes with it.
- Published medians range widely: Instagram sits near 0.5% by followers in some studies and above 5% in others. Compare only like with like.
- TikTok is best judged by views, where one 2026 analysis found a 3.95% median. Reels win on reach, carousels on visible interaction.
- Write the formula, the format, the posting window, the usage rights and the payment schedule into the brief before the first post is made.
- ANT books influencers and creatives for shoots, events and shows anywhere in the world, through a managed booking or the ANT Talent App.
Table of Contents
- What engagement rate actually measures
- Instagram benchmarks: why the figures disagree
- Reels, carousels and static posts
- TikTok engagement rate: average, median and the view-based lens
- Turning a benchmark into a target
- Influencer deliverables: what to specify
- Posting schedule and turnaround
- Payment terms, usage rights and exclusivity
- Our perspective
- Book influencers and creatives with ANT
- FAQ
- Sources
What engagement rate actually measures
Engagement rate captures the interaction a piece of content earns: likes, comments, shares and saves. The IndiKit guidance on the indicator defines it as total engagements divided by a chosen denominator, multiplied by 100. The denominator is where benchmarks part ways.
The Hootsuite guide to calculating engagement rate lists the common choices: followers, reach or impressions. Each answers a different question.
- By followers: how much of the existing audience responds. Useful for comparing creators with different audience sizes.
- By reach: how much of the audience that actually saw the post responds. Closer to creative quality.
- By views or impressions: how much each viewing earns. The natural lens for video that travels beyond a creator’s own audience.
Platforms add their own wrinkles. Buffer’s 2026 engagement study notes that LinkedIn counts clicks, that TikTok engagement is measured against reach, and that each platform’s metric should be read as a within-platform benchmark. A 4% result can underperform on one network and outperform on another.
The practical consequence for a brand: when a creator quotes a rate, ask which formula produced it and over how many posts. A rate without a formula is an adjective, not a number.
Instagram benchmarks: why the figures disagree
Instagram offers the clearest illustration of how method shapes a benchmark. Four recent sources, four different answers:
| Source | Reported Instagram figure | What it measures |
|---|---|---|
| Buffer, 2025 data | About 5.46% median | Analysis of 52 million-plus posts across networks |
| Hootsuite, 2026 | 4.2% | Best-performing content type |
| Socialinsider, 2025 | 0.48% | Engagement rate by followers |
| Rival IQ, 2025 report | Down 16% year over year | Median of company accounts with at least 5,000 followers |
None of these is wrong. A figure near 0.5% typically divides by the full follower count, while a figure above 5% usually reflects a different denominator or a different sample. Rival IQ’s study also shows direction: engagement fell year over year on every platform it tracked, by 36% on Facebook, 16% on Instagram, 34% on TikTok and 48% on X. Buffer adds a caution that such movement can reflect algorithm changes, posting mix and account maturity as much as the health of a platform.
How to use this. Pick the benchmark whose formula you will also use to judge the campaign, then compare the creator against accounts of similar size in the same sector. Hootsuite makes the same point: the useful comparison is a similar-sized account in your own category, not an all-industry average.

Reels, carousels and static posts
A creator’s mix of formats changes the rate as much as their audience does. Two bodies of data pull in complementary directions.
In Dash Social’s H1 2026 beauty benchmark, Reels earned a 2.7% engagement rate, against 1.4% for carousels and 1.3% for static images. Buffer’s analysis of more than four million Instagram posts tells the other half of the story: Reels generated 36% more reach than carousels, while carousels generated 12% more engagement than Reels.

Read together, the lesson is about objective. Reels are the format for discovery, the motion that carries a product to people who do not yet follow the creator. Carousels are the format for depth, where a viewer lingers, swipes and saves. A launch built for awareness should specify Reels and judge them by reach and views. A campaign that needs consideration, such as a collection, a menu or a venue, should add a carousel and judge it by saves and comments.
For entertainment and music campaigns, short-form cuts do much of the discovery work, and brands often plan short social media clips alongside the main asset so each format can be measured on its own terms.
TikTok engagement rate: average, median and the view-based lens
TikTok benchmarks diverge the most, because the For You feed can carry a video far beyond an account’s followers. That is why many analysts measure against views rather than followers, a point made in this 2026 campaign benchmark review.
The published numbers show the spread:
- By follower, 2023 data: Rival IQ’s TikTok study of more than 374,000 videos from over 2,000 accounts found a 2.6% median by follower and a 3.4% average by view. Nearly half of the brands it tracked averaged below 2% by follower.
- By follower, 2025 data: Quid’s 2026 benchmark reports 2.01% for TikTok, against 0.21% for YouTube and 0.03% for X.
- By views, 2026: an analysis of 460,483 TikTok posts found a 3.95% median and a 5.38% mean. Because the distribution was heavy-tailed, with 63.7% of posts below the mean, the median is the more honest description of a typical post.
- Large accounts: Infloo reported in July 2026 a median of 9.05% on TikTok against 0.51% on Instagram for very large accounts.
The median matters more than the mean. A few viral videos lift an average and mislead a media plan. When a creator shows you their numbers, ask for the median of their last twenty posts, not the highlight reel.
Turning a benchmark into a target
A benchmark is a reference point, never a guarantee. A workable approach:
- Fix the formula. State in the brief whether the rate is by followers, reach or views, and which platform insights will be shared.
- Choose the comparison set. Accounts of similar size, in the same sector and the same format.
- Set a range, not a figure. A band around the creator’s own trailing median is fairer than an industry average.
- Match the metric to the objective. Views and reach for awareness. Saves, shares and comments for consideration. Link clicks and codes for conversion.
- Request screenshots of native analytics at a fixed point after posting, such as seven days, so every creator is measured on the same clock.
For brands comparing measurement platforms, our guide to social media analytics tools covers what to look for. If you are deciding between gifting and paid placements, the five point rule for seeding versus paid influencers is a useful frame.
Influencer deliverables: what to specify
A benchmark only means something when the deliverable is defined. The strongest briefs name the format, the count and the conditions. Typical deliverables include:
- Short video: a Reel or TikTok of a stated length, with the hook, key message and any required product shots.
- Carousel or static set: a number of frames, with caption requirements.
- Stories: a sequence of frames, often with a link or sticker.
- Long-form video: a dedicated YouTube integration or a full review.
- Raw footage and stills: unedited assets handed over for the brand’s own channels.
- Event presence: attendance, live coverage and a post-event recap.
- Paid-media assets: content cleared for use as ads, which brings in whitelisting and usage rights.
For each item, a contract guide for influencer campaigns recommends covering format, quantity, deadline and caption requirements. We would add approved hashtags, tagging rules, the disclosure wording the creator must use, and the number of revision rounds included.
Posting schedule and turnaround
The schedule should follow the objective, not the calendar. A product launch benefits from a concentrated window, with a teaser, a launch-day post and a follow-up that answers questions. A brand building familiarity benefits from steady cadence over months.
The second pattern is now the norm. The Northwestern Medill Creator Marketing 2026 study found that 91% of brands run an always-on creator programme, 29% fully continuous and 62% hybrid, rather than relying only on one-off bursts.
A clean schedule in the brief names:
- Draft deadline: when the creator submits content for approval.
- Approval window: how quickly the brand responds, which is often the real cause of delay.
- Revision rounds: how many, and how fast.
- Go-live date and time: with a backup slot.
- Minimum live period: how long the post stays up and unedited.
- Reporting date: when analytics are due.
Build turnaround around the slower party. Creators can often deliver quickly, but approvals, legal checks and product shipping usually set the pace.
Payment terms, usage rights and exclusivity
Payment is where good campaigns stall. The terms to settle in writing before work starts:
- Fee and scope: the total, what it covers, and what counts as extra.
- Schedule: a common structure is half upfront and half on approval, according to one contract guide, which also describes net-30 as a standard payment window and treats anything beyond net-60 as a red flag for creators.
- Usage rights: which platforms, which territories and for how long. Paid use of a creator’s content is a separate licence from organic posting, and unplanned extensions can add significant cost. Our piece on influencer usage rights explains how to avoid paying 50 to 100% extra.
- Whitelisting: running ads through the creator’s handle needs explicit permission and a defined period. See our whitelisting playbook.
- Exclusivity: which competing categories the creator avoids, and for how many days either side of the post.
- Revisions and cancellation: how many rounds, and what happens if a job is cancelled close to the date.
The same discipline applies to any talent booking. Our own booking terms, for example, state overtime at 15% per hour, cancellation within 48 hours at 50%, cancellation within 24 hours at 100%, and late payment at 9% per month, all published on the booking terms page. Clear terms protect both sides.
Our perspective
A benchmark is a mirror held up to a creator, and the reflection depends on the light. We see the strongest campaigns begin before a single frame is shot, with a brief that names the formula, the format and the objective in the same breath.
Choosing a creator for a rate alone is like casting a model for a single angle. What matters is how the work moves: the rhythm of the content, the audience that responds, and whether the talent can carry a brand across a shoot, an event and a feed without losing identity.
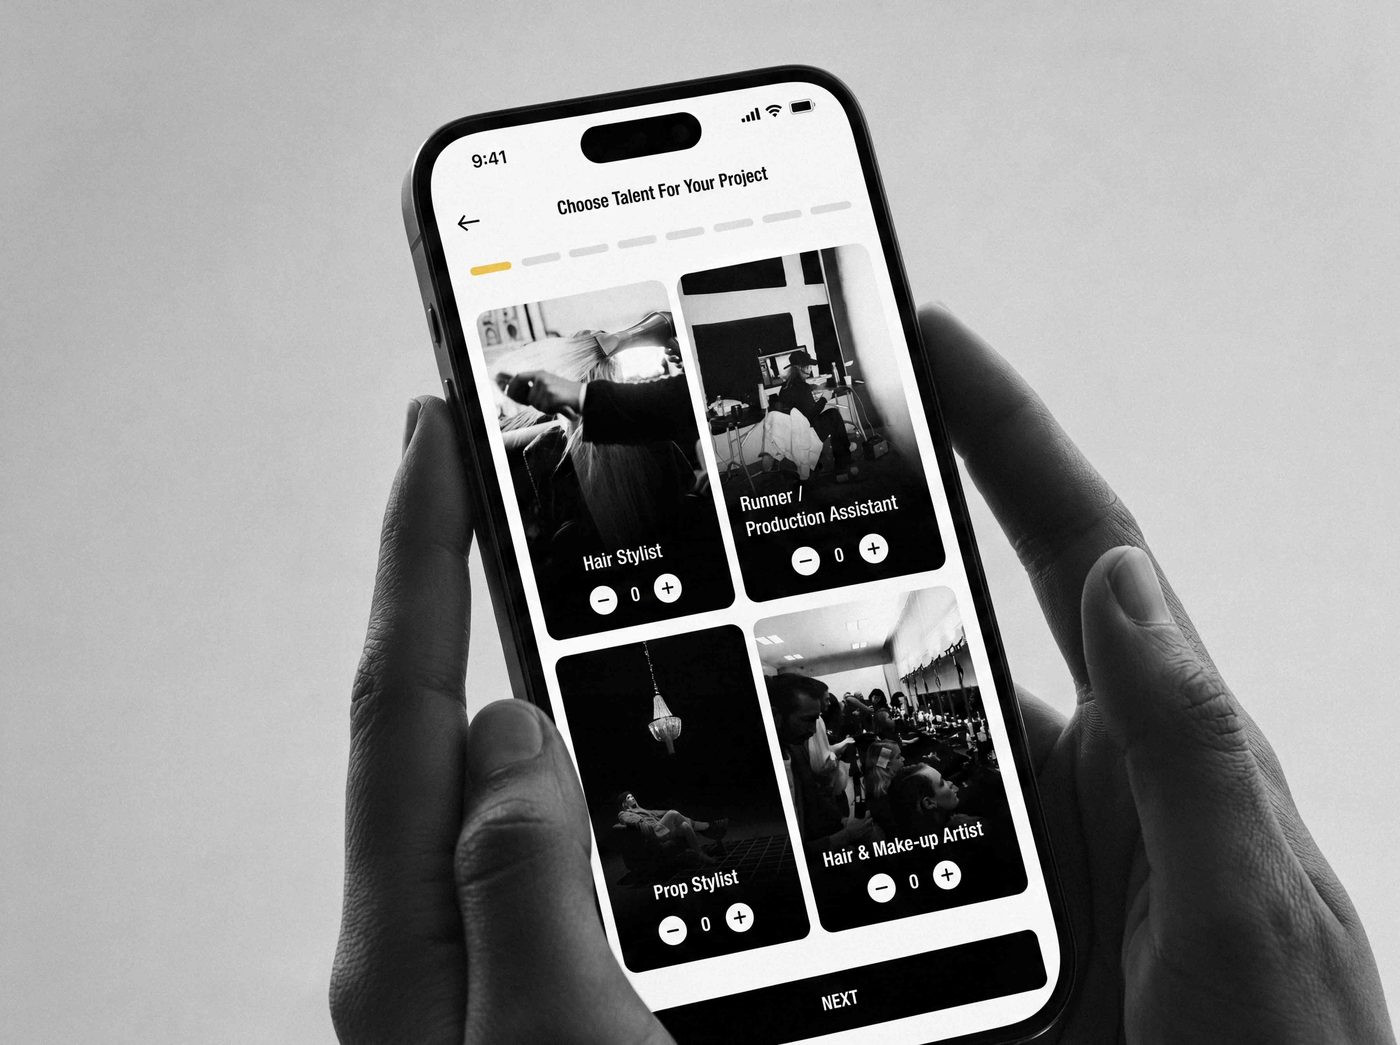
That is why we pair influencer booking with the rest of the production world. One agency can supply the creator, the model, the hostess, the videographer and the stylist, with a shortlist of available talent within an hour in working hours. Where a brand wants control and speed, the ANT Talent App lets it post a job and book vetted talent directly, with payment held until the job is done.
Talent, in the end, is a performance measured in people. We book it for shoots, events and shows anywhere in the world.
ANT
Book influencers and creatives with ANT
ANT Management is a licensed talent agency in Dubai, rated 5.0 on Google from more than 200 reviews. Brands, agencies, producers and event companies book influencers in Dubai, along with models, hostesses, creatives and full production crews, for work in the GCC or anywhere in the world.
The ANT Talent App is built for speed: post a job and book vetted models, actors, influencers and creatives in Dubai in minutes, with verified profiles and escrow-protected payment processed by Stripe. Coverage spans the UAE, Kuwait, Qatar and Saudi Arabia, and current prices are shown in the app. Clients who prefer a managed service can book through ANT Management directly at info@antmgmt.com, or start from our talent booking page.
FAQ
What is a good engagement rate for an influencer?
It depends on the formula and the platform. Published medians run from about 0.5% by followers on Instagram to around 4% by views on TikTok. Compare the creator with similar-sized accounts in your sector, using the same formula for both.
Is engagement rate by followers or by views better?
Follower-based rates suit comparing creators with different audience sizes. View-based rates suit video that travels beyond the follower base, especially on TikTok. State your choice in the brief and use it consistently across every creator in the campaign.
How many deliverables should a first campaign include?
Enough to read performance across formats, usually a short video plus a supporting carousel or stories set per creator. Add more only once the first results show which format answers your objective. Always define revisions, usage rights and the live period.
How should influencers be paid?
A common structure is a share upfront and the balance on approval, with a clear payment window and consequences for late payment. For managed bookings through ANT, payment terms are set in the booking agreement, and the ANT Talent App holds payment in escrow until the job is done.
Sources
- IndiKit: Guidance on engagement rate indicator
- Hootsuite: How to calculate engagement rate
- Hootsuite: Average engagement rate benchmarks
- Buffer: The State of Social Media Engagement in 2026
- Buffer: Instagram reach and engagement analysis
- Socialinsider: Social Media Benchmarks
- Rival IQ: 2025 Social Media Industry Benchmark Report
- Rival IQ: 2024 TikTok Benchmark Report
- Quid: 2026 Social Media Industry Benchmark Report
- Dash Social: H1 2026 beauty industry benchmark
- Buzzabout: Average TikTok engagement rate
- Infloo: Influencer engagement rate benchmark guide
- Influencer campaign performance benchmarks 2026
- Influencer contract guide
- Northwestern Medill: Creator Marketing 2026, Wave 4
- Music Video Marketplace: short social clips
Two ways to book: send a booking request to ANT Management, or post a job on the ANT Talent App and book vetted models, actors, influencers and creatives in Dubai in minutes, with escrow-protected payment.
Recommended
Planning a shoot in KSA?
Prefer to book on your phone?
Post a job on the ANT Talent App and let approved talent come to you.
- Every profile approved by ANT
- Chat with talent in the app
- Payment held until the job is done

Free on iPhone
- 5.0on Google, 200+ reviews
- Since 2022modelling and talent agency
- Worldwideshoots, events and shows anywhere
- Licensed in Dubai. See our licence and booking terms